# 09-12 Multiclient results
Today I tested the multiclient setup. I caught a pretty big bug with the redis cache adapter for saving measurements. To prevent memory leakage, I delete old measurements as soon as lists get 1000 measurements long. This caused calibration measurements to unintentionally be deleted, even though there should be no size cap for calibrations. Data for calibration steps below 1.25 meters appeared to have been consistently deleted in the multiclient setups with many measurements. Luckily this shouldn't have been an issue with all previous single client setups, since there weren't nearly as many measurements.
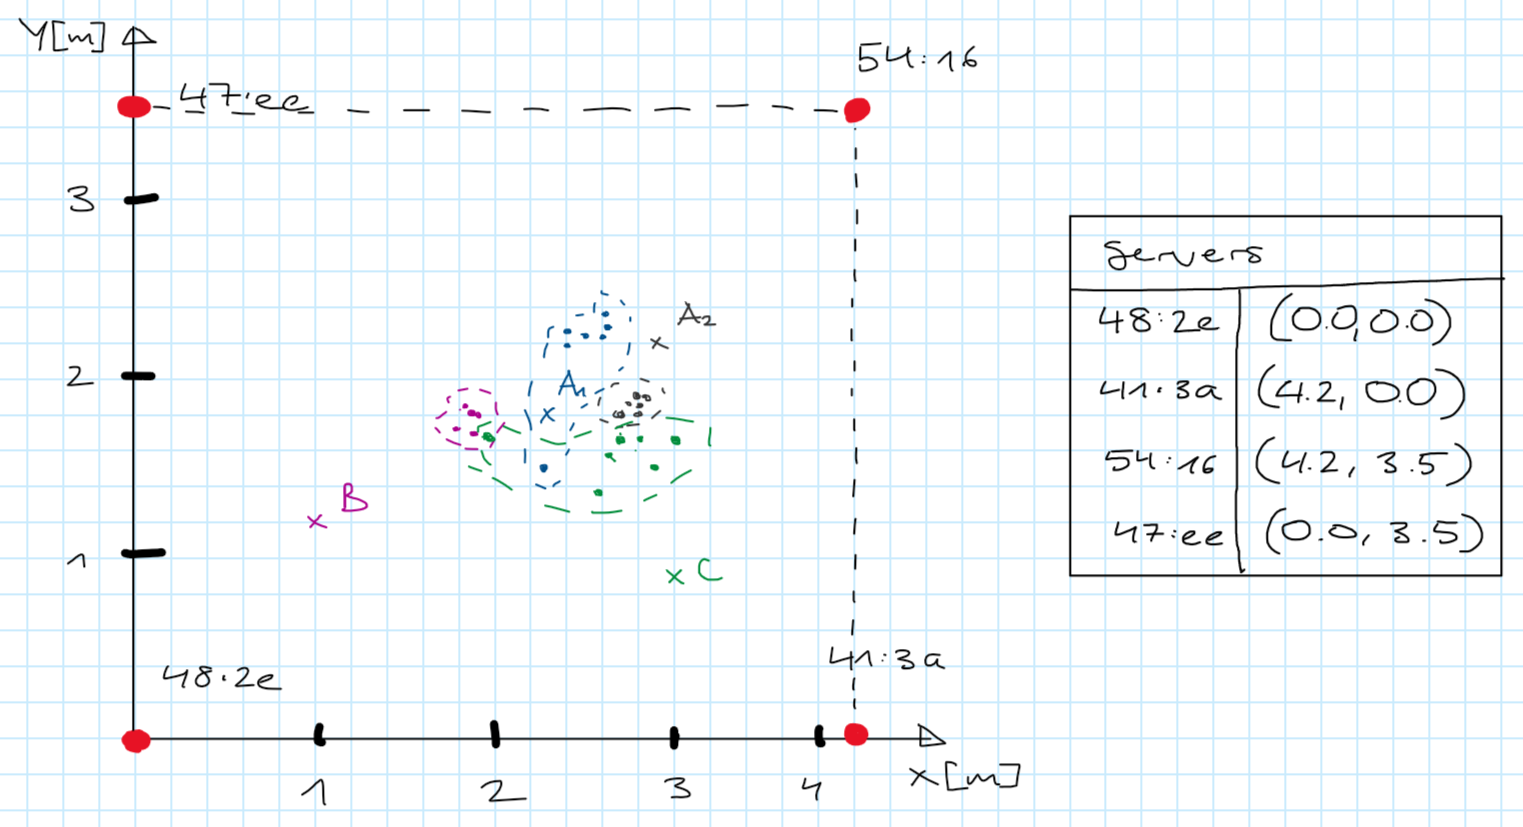
Now to the results: Below are some samples from the log files. The first row of each table is always the actual position tuple and the subsequent ones are the server estimates. The test field is x = 4.20m and y = 3.5m large. There were only 4 servers active. A new row was calculated once every 250ms.
# Case A: Middle
When placed in the middle of the grid, the coordinates are quite accurate in X and Y direction. The error is roughly 40 cm. This isn't perfect, but also more than enough to figure out where something is in a normal sized room.
# 1 (blue)
| 2.30 | 1.80 |
|---|---|
| 2.32 | 1.45 |
| 2.63 | 2.25 |
| 2.44 | 2.26 |
| 2.4 | 2.20 |
| 2.61 | 2.27 |
| 2.66 | 2.27 |
| 2.48 | 2.25 |
| 2.42 | 2.20 |
| 2.38 | 2.16 |
| 2.46 | 2.28 |
# 2 (gray)
| 290 | 2.10 |
|---|---|
| 2.71 | 1.82 |
| 2.71 | 1.80 |
| 2.79 | 1.80 |
| 2.8 | 1.82 |
| 2.79 | 1.90 |
| 2.76 | 1.85 |
| 2.76 | 1.84 |
| 2.79 | 1.81 |
| 2.81 | 1.82 |
| 2.89 | 1.76 |
| 2.82 | 1.89 |
# Case B: Clients close to corners (purple)
Accuracy decreases when the clients are placed close to the corners (here we are close to the origin 0,0) where the servers are placed. I presume this is because it is quite far away from the other three corners and their servers. Previously we found out that the RSSI quality suffers when there are large distances between devices. Therefore it is harder to calculate correct distances. Here the values are too close to the middle.
| 1.00 | 1.20 |
|---|---|
| 1.93 | 1.80 |
| 1.9 | 1.83 |
| 1.84 | 1.83 |
| 1.82 | 1.77 |
| 1.9 | 1.73 |
\newpage
# Case C: Close to edge
This time the clients were placed fairly close to the X-axis (0.90m) and more or less in the middle of the field in X direction. Here the X coordinates struggle a bit, but they are definitely better than the Y components. These are once again way too close to the middle.
| 3.00 | 0.90 |
|---|---|
| 2.7 | 1.69 |
| 2.69 | 1.73 |
| 2.65 | 1.72 |
| 1.81 | 1.69 |
| 2.7 | 1.71 |
| 2.91 | 1.53 |
| 3.01 | 1.65 |
| 2.57 | 1.46 |
| 2.76 | 1.77 |
# Further actions:
I need to do some more testing with higher beacon densities. I think the results might be better if there is no more than 2m between beacons. First I will move forward with the GUI though. It is easier to evaluate things when one can look at the results live.