# 09-23
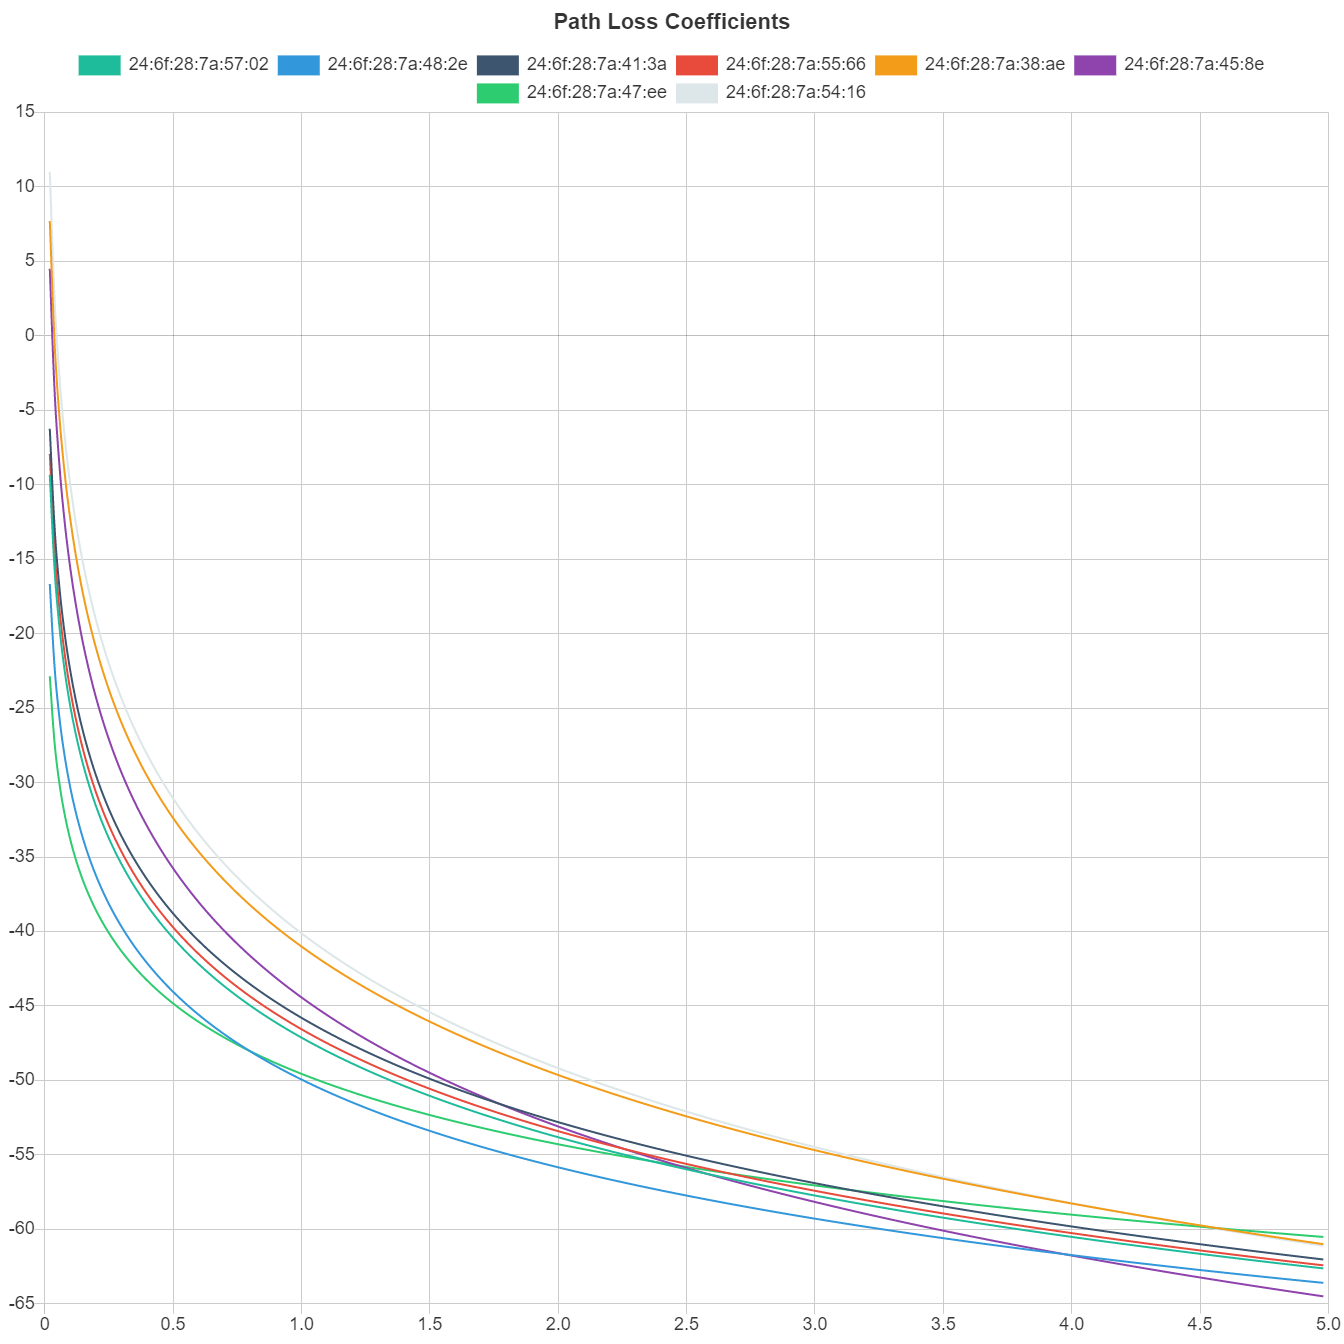
Today I worked on graphing the estimated coordinates on a map in real time. I then tested it in real time. The setup consisted of a single Raspberry Pi as opposed to the tri-client setup. All eight beacons were active and calibrated, which yielded the graph down below.
 { width=60% }
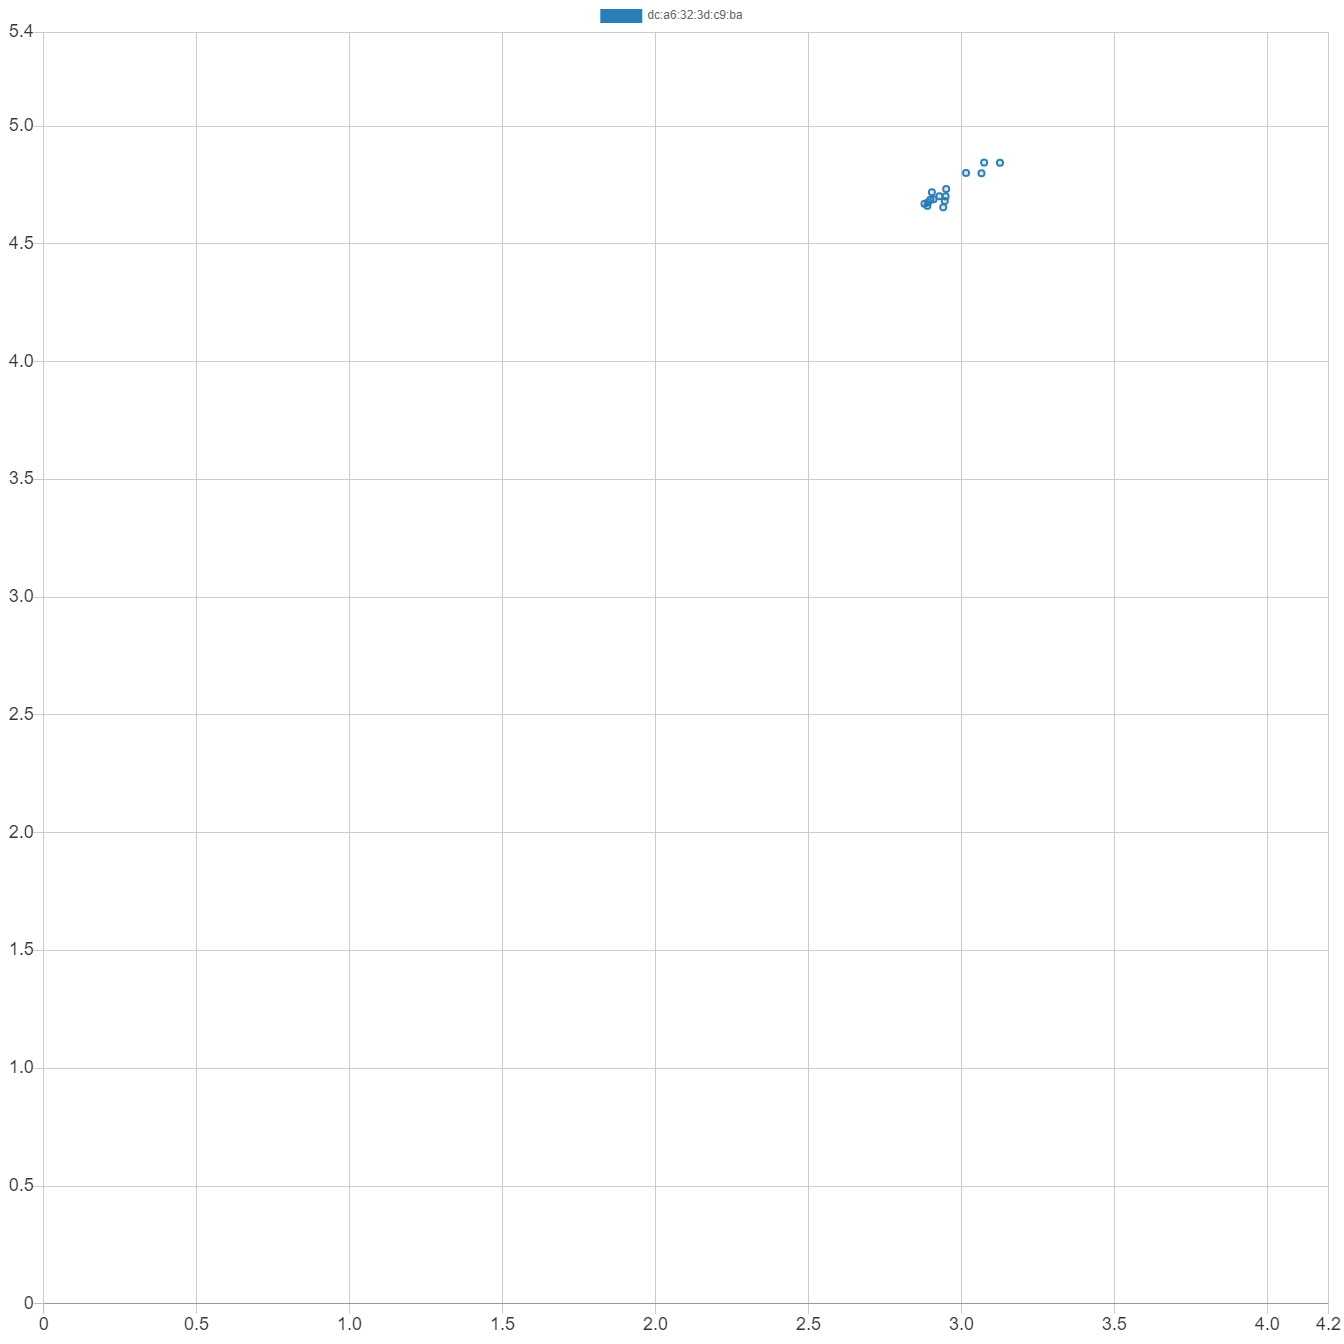
For the top right area of the chart, accuracy was perfect. The software unambiguously indicated that the client was at roughly (3, 4.5). This estimation was spot on. What was another reason to be content was the tight clustering of the results despite the refresh rate of the trilaterator being set to 10 Hz. In that sense, the system consistently and continuously yielded perfect results.
 { width=60% }
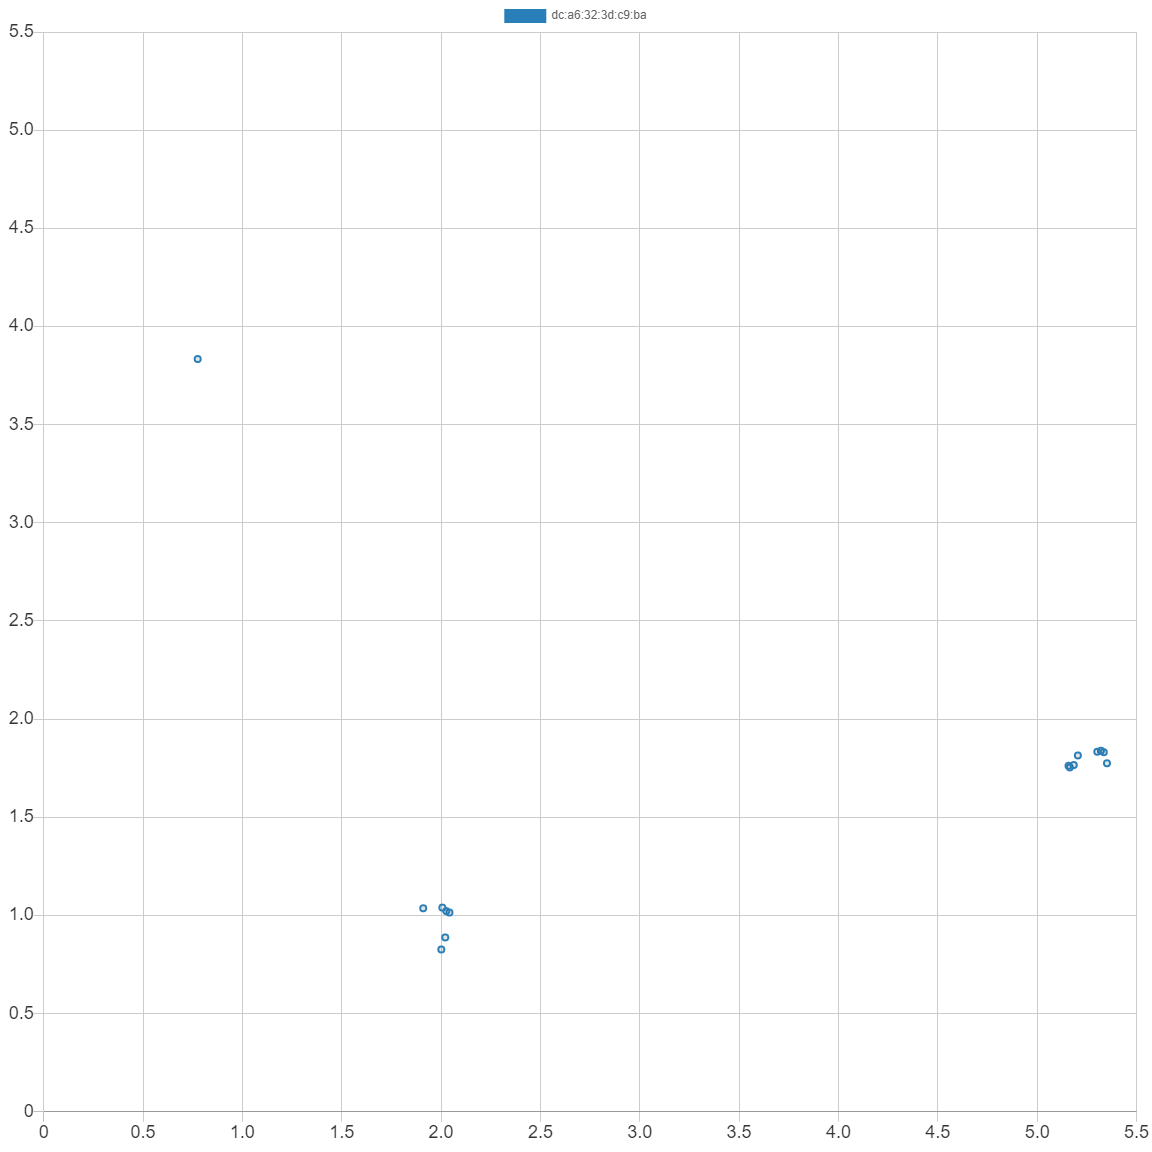
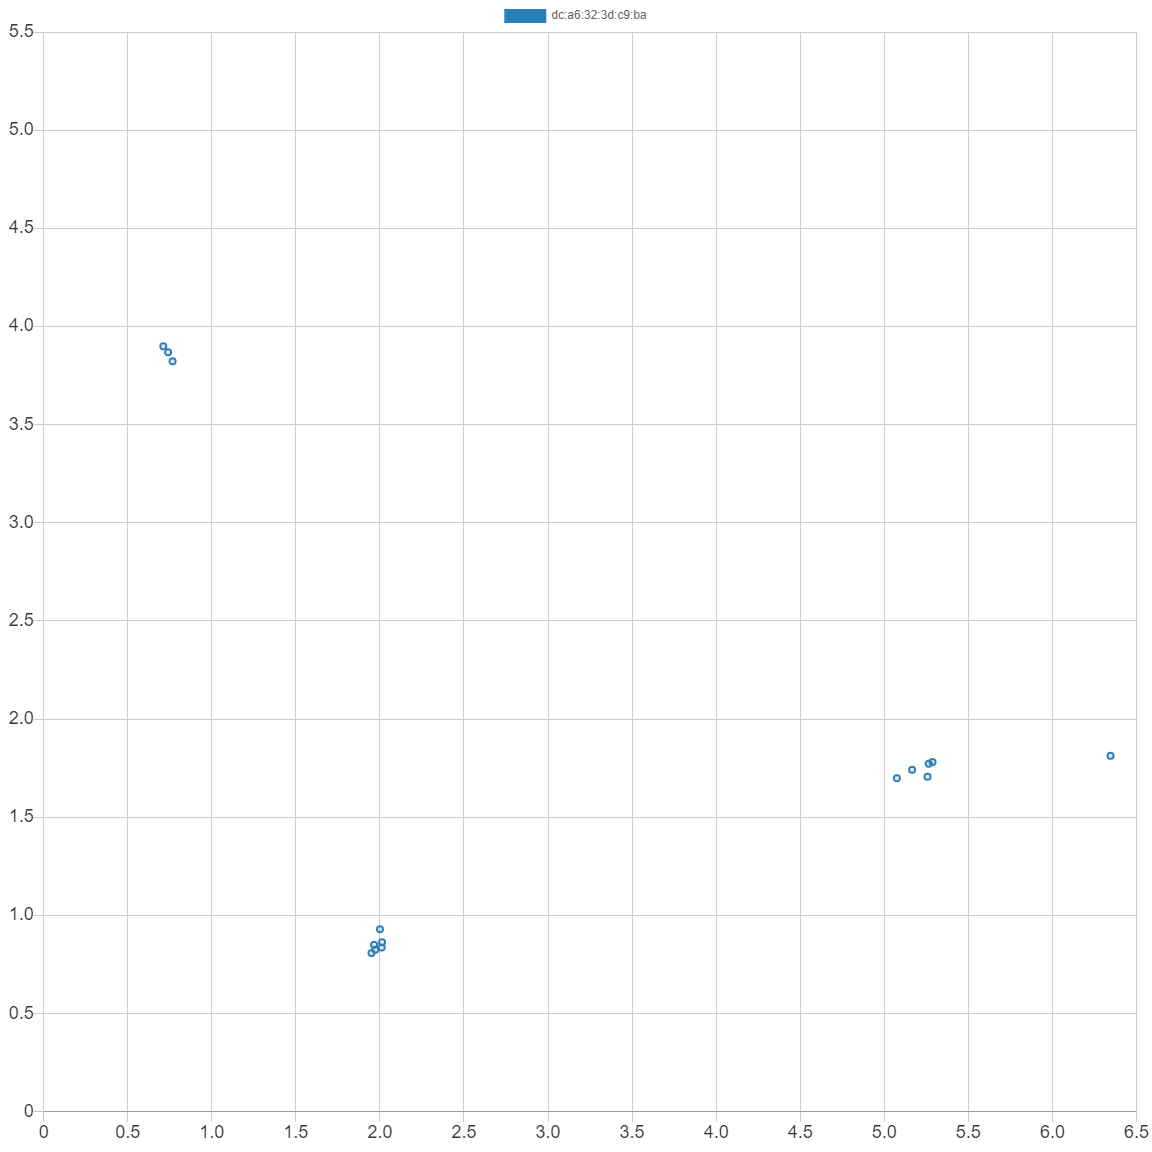
The results were less convincing in the lower half of the test field. In the bottom two examples for some reason the API thought the client was in two places at once. Note that the X-Axis extends beyond the actual x-length of the field (4.2 meters). Interestingly enough, the real position was pretty close to being directly in the middle of the two clusters around (4.2, 1.5) This suggests that averaging the coordinates to yield a final (X, Y) estimate could help alleviate the splintering of position estimation clusters in different areas of the field.
 { width=60% }
 { width=60% }
The next logical step is going to be to test this setup with the multiclient setup and see if the position estimates are better with spatial separation. Also worth researching is the effect of averaging coordinates for a final result.