# 09-16 PLM Constant Visualization
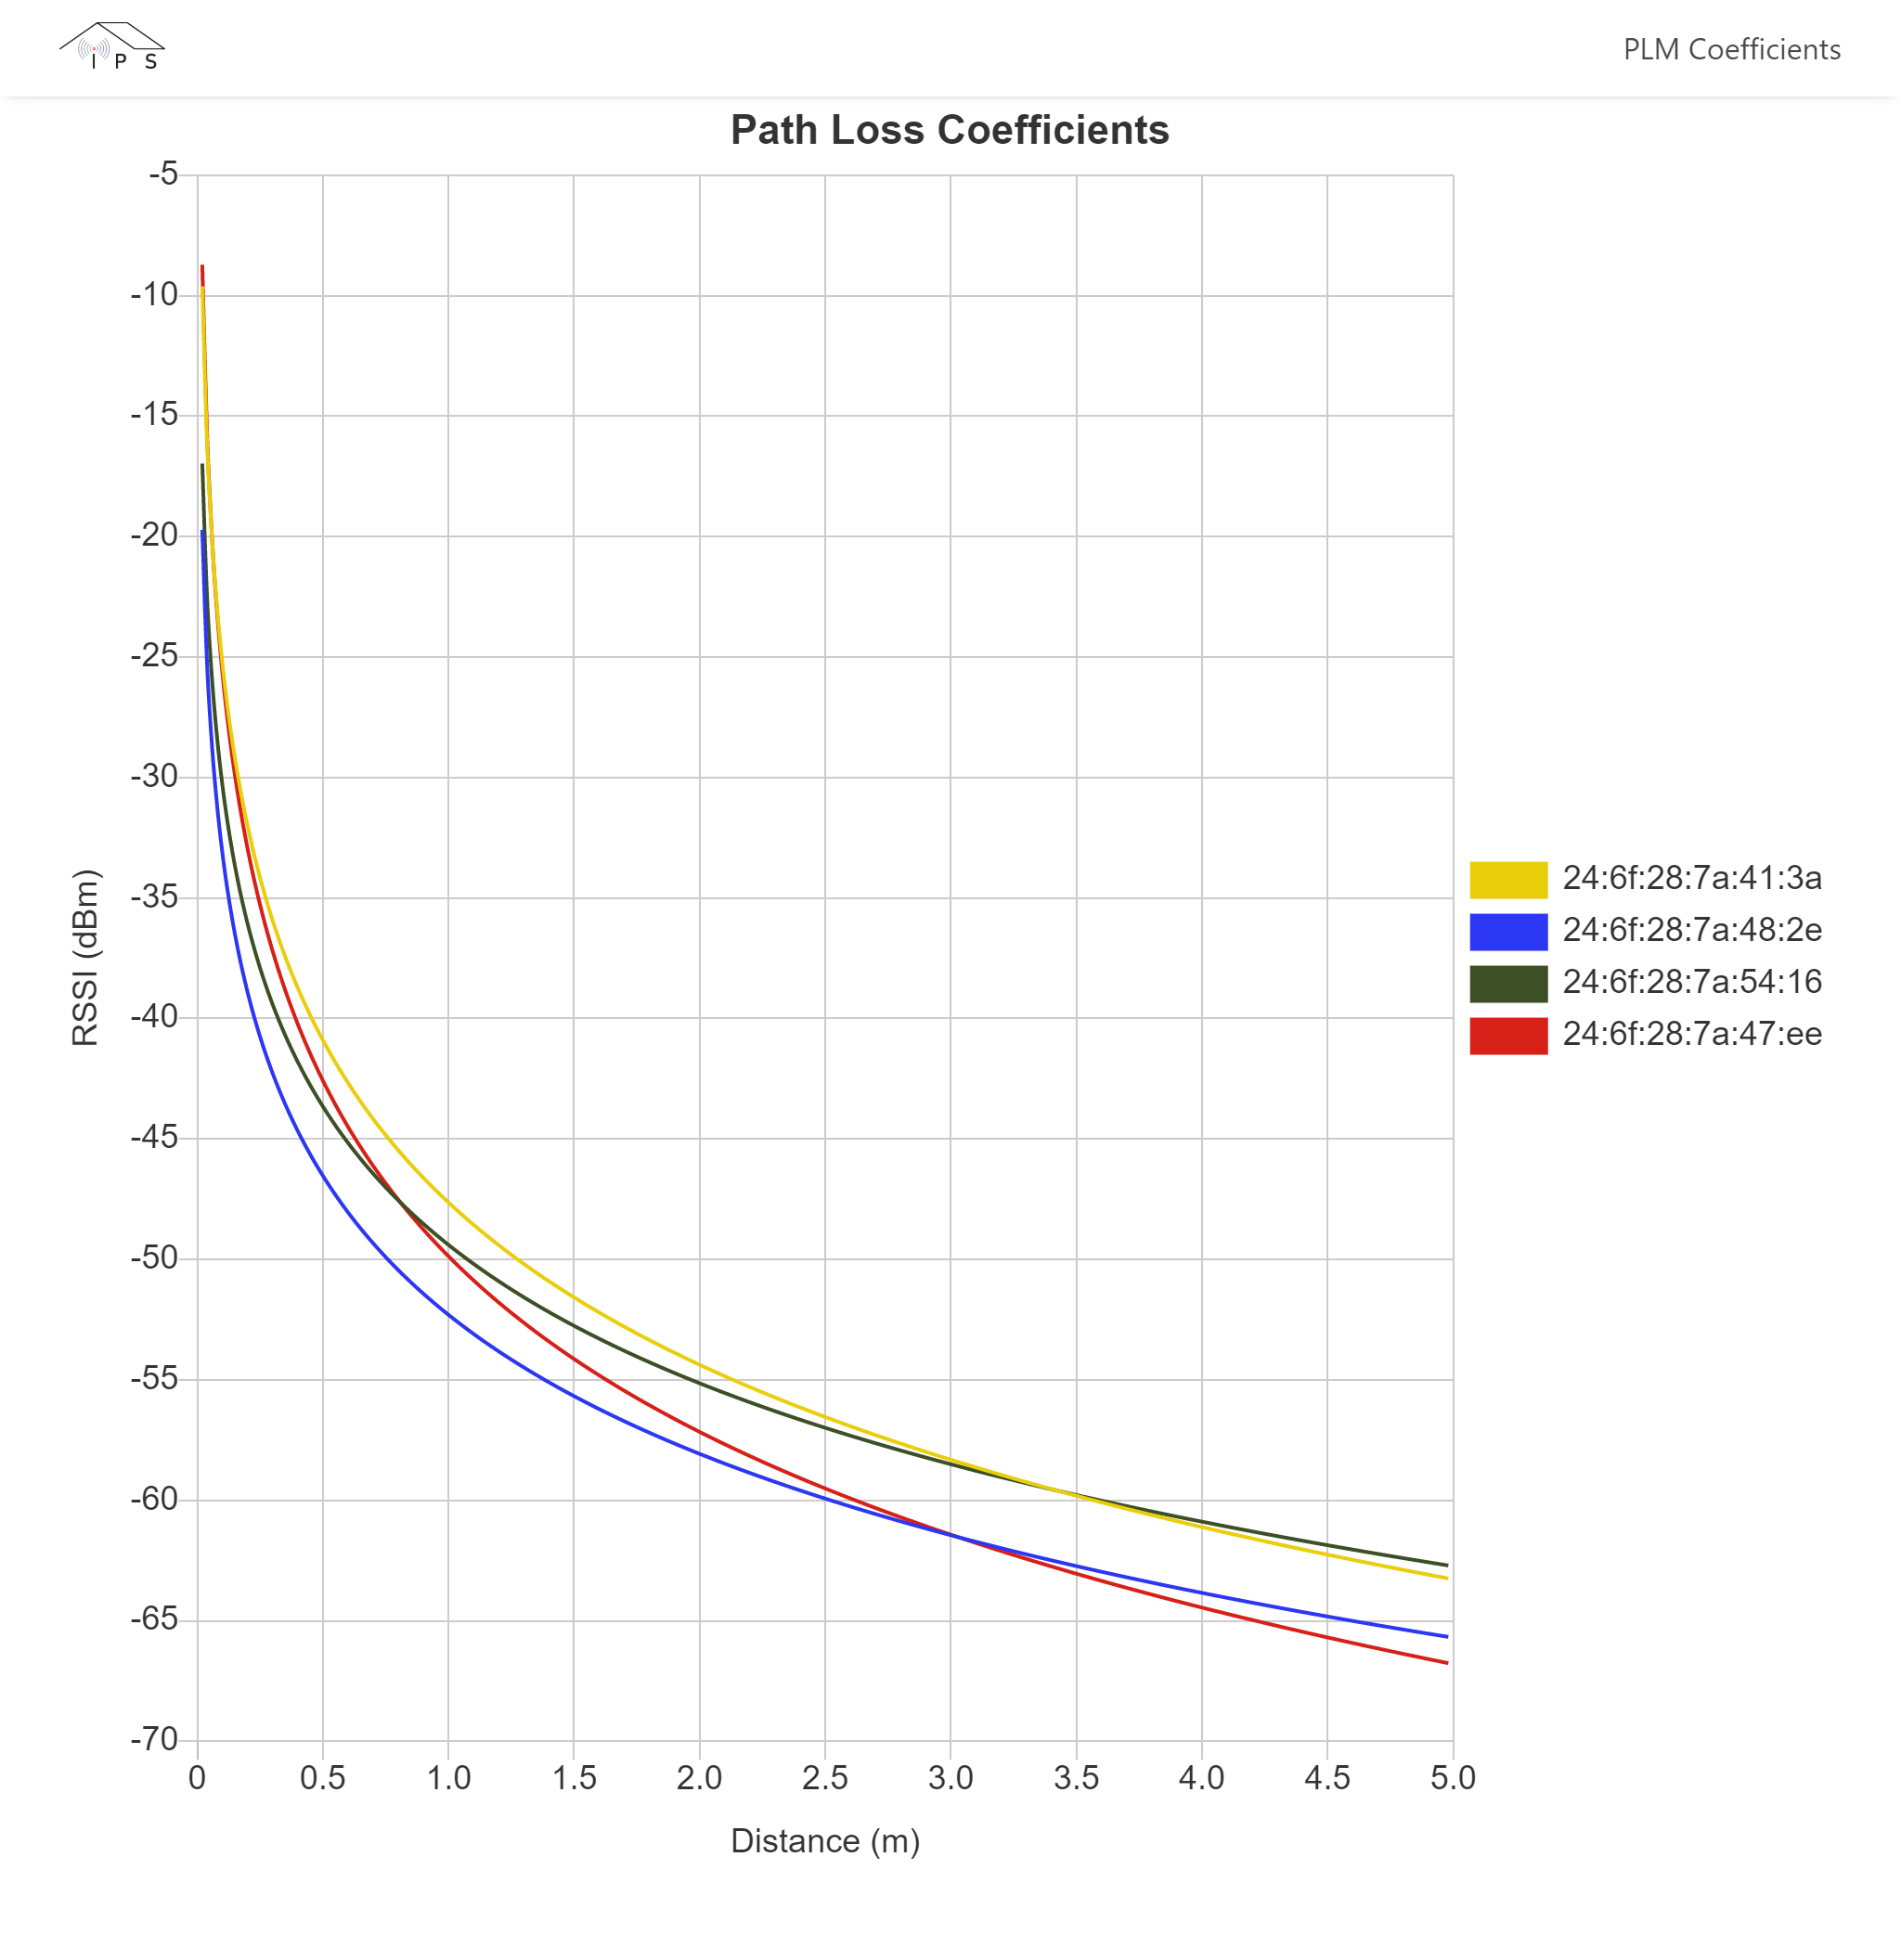
As a way to work myself into the new library, I set up this page that graphs the path loss constants of the different beacons using real data. There were no issues. Next I will see about saving positions and displaying them on a coordinate grid.
 { width=60% }